
"Beware the Jabberwock, my son!
The jaws that bite, the claws that catch!
Beware the Jubjub bird, and shun
The frumious Bandersnatch!"
Getting Started
- First create a directory to contain your lisp sources, if you have not
yet done this.
- Start the IDE by running 'Jabberwocky'
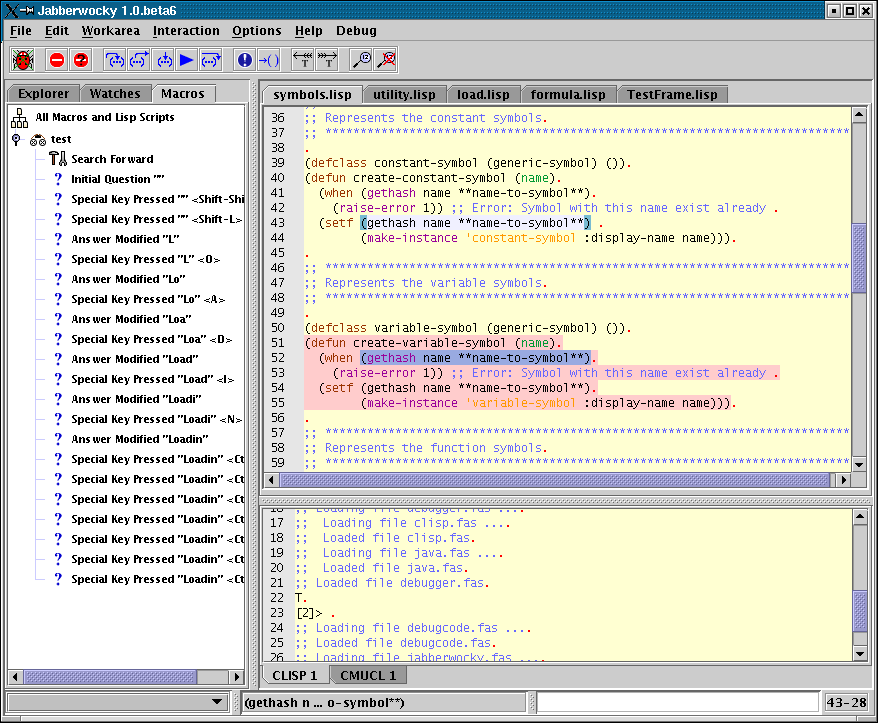
- Now a window like this should appear.The right pane is the
project explorer and contains the project directories and source files.
For each source file a list of function definitions and macro definitions
is visible.
- Right click on 'Projects' and choose <Add Project>.
This will start a open
file dialog box. Choose the directory that you have created to
contain your source files. This dialog box also allows you to create a
directory if you have not done this in (1). For a description of project management
see project management
- Right click on your directory in the project pane and choose <New
File>, a dialog box asking for the name of the file will now
appear. Be sure not to enter the .lisp extension. Jabberwocky will
automatically add this extension for you and will recognize lisp files by
this extension. The right pane of Jabberwocky contains now a editor
buffer, you can enter now your LISP code. For a description of the editor
see Editing documents.
- Right click in the middle of the editor buffer, choose
<File><Save> to save your code.
- Type in the following code to test debugging
(defun fac (n) (if (zerop n) 1 (* n (fac (1- n)))))
- From the <Interaction> menu choose <New Interaction
with CMUCL> or <New Interaction with CLISP> depending
on the LISP version that you have used during install. In the bottom pane
of Jabberwocky you will now see a interaction buffer which allows you to
communicate with the chosen LISP. For a description of the interaction
with a LISP process see Interacting with a LISP
process.
- Click back on the editor buffer and click then on the
 button. This will add
instrumentation code to your source and load the instrumented version of
your code in the LISP system. The button bar should now change to contain
the buttons needed for debugging. See Debugging
for a description of debugging.
button. This will add
instrumentation code to your source and load the instrumented version of
your code in the LISP system. The button bar should now change to contain
the buttons needed for debugging. See Debugging
for a description of debugging.
- Click on the word fac in the editor buffer and press
<F9>, you have placed now a breakpoint on the lisp form
(defun fac (n) (if (zerop n) 1 (* n (fac (1- n))))), this is indicated by
a change in background color.
- Go to the interaction buffer and type (fac 3), the system will now
highlight the lisp form defining fac, you can now step through the code
using <F7>
- When finished, close Jabberwocky via <File><Exit>
The user interface of Jabberwocky contains the following components (see
figure)
- A menu bar
- This is located at the top of the window, and can change
depending on the mode of the current editor buffer.
- A button bar
- This provides you with a shortcut for the most used functions.
The menubar changes depending on the mode of current buffer.
- Explorer Pane
- The explorer pane is a tabbed pane at the left containing three
tree views, the project explorer, the watch explorer and the macro
explorer. By right clicking on nodes in the project explorer you
can add new projects, new files, new folders, delete files and
folders, copy and paste files and folders or open a file. Source
files also contains nodes for the defined functions (normal,generic
or methods) and for the defined macros in that file. Clicking twice
on such node opens the corresponding file (if it was not yet
opened) and positions the cursor in the editor buffer so that the
function (macro) is visible. When you edit a buffer the list of
functions (macros) is kept up to date. In the watch explorer you
can consult the values of the watch points or change the definition
of a watch point. In the macro explorer you can see the defined
macros, create new macros, replay existing macros and delete
existing macros.
- Editor Pane
- The editor pane is a tabbed pane that contains the different
editor buffers.
- Interaction Pane
- This is a tabbed pane containing a Task window, all the interaction and watch
buffers.
- Error Area
- A combo box at the right bottom of the window, containing all the
error and warning messages generated.
- Message Area
- A area to display messages
- Input Area
- A text field used for input during some actions (like Incremental
Search).
- Shortcuts
- There exist a lot of keystrokes to activate one of the actions
available in Jabberwocky, for a complete list see Key mappings.

Jabberwocky contains a explorer pane allowing you manage (in a limited way) a
project. Project management in Jabberwocky is based on the file system and uses the
directory structure of the file system to define the folders containing the lisp
source files, no project configuration files are used (and I plan to keep it that
way, (I'm really sick of corrupt or incorrect project and solution files in Visual
Studio from Microsoft)). Because projects are essential directories it is very easy
to copy or archive projects (just copy or archive the directory). Of course
project management needs more then just folders and sourcefiles, but all the extra
information is generated by analyzing the source files when a project is opened (this
happens in background but for a big project it can have some performance impact on
the editing of a buffer). Jabberwocky will remember all the open projects as part of
its state when you stop Jabberwocky.
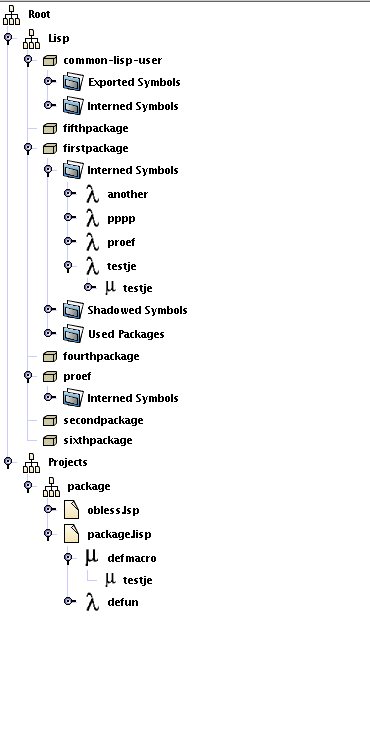
The first level of the explorer window contains repository nodes (currently only a lisp repository is possible) and the projects node. The following node types exist:
 Repository node
- This node represents the lisp repository. It gives you a list of the different packages defined in the different projects and the symbols in these
packages. The name of the repository node reflects the type of the repository (for the moment only lisp is possible). When you right click on the repository node you get a list of possible lisp processes to associate with this repository, if you choose one then a hidden lisp process is started and associated with the repository. This lisp process is used for evaluation pathname expressions so that the repository can associate a pathname expression with a real filename.
 Package node
- This node represents a package defined in one of the projects. The package node contains a subfolder for the exported,interned, shadowed symbols and the used packages.
 Exported Symbols
- The exported symbols of a package.
- Interned Symbols
- The interneded symbols of a package.
- Schadowed Symbols
- The schadowed symbols of a package.
- Used Packages
- The packaged used.
- Projects node
- This node contains all the projects know by Jabberwocky
- Default project node
- This node contains all the opened files which are not in one of the open projects.
- Project Node
- This represents the project directory, all its subdirectories and all lisp source files in it. Only files with a lisp extension (default .lsp or .lisp) will be displayed. The set of lisp extensions can be edited via <Options><Edit Extensions>. You can also set the option Automatic setting of current directory to project directory via the Options menu, setting this option ensures that the current directory is reset to the project directory whenever you click on the project. Right clicking on a project node gives the following options in a popup menu:
- Remove Project
- Removes the project from the explorer (but does not delete the project file).
- New Folder
- Creates a new subdirectory in the project directory.
- New File
- This menu option contains a list of options to create source files with the known file extensions
- Directory Node
- This represents a directory, all its subdirectories and all lisp source files in it. Only files with a lisp extension (default .lsp or .lisp) will be displayed. The set of lisp extensions can be edited via <Options><Edit Extensions>. Right clicking on a directory node gives the following options in a popup menu:
- New Folder
- Creates a new subdirectory in the project directory.
- New File
- This menu option contains a list of options to create source files with the known file extensions
- Rename
- Renames the directory associated with this node.
- Delete Folder
- Delete the directory (and its content) associated with this node
- Copy
- Remembers the directory node, so that it can be used later in a paste operation.
- Paste (only available if a previous a copy is done)
- Copies the node remembered in the previous copy beneath this node (copying files and subdirectories if needed).
 File node
- Represents the different source files recognized by Jabberwocky (by default files with extension *.lsp and *.lisp). The parent of a file node is always a directory node or a project node. Right clicking a file node gives the following options:
- Open
- If a editor buffer containing the file associated with this node is already opened, make this editor buffer current, in the other case open a editor buffer containing the file associated with this node. Double clicking on this node will have the same effect.
- Delete
- Delete the file associated with this node.
- Copy
- Remembers the file node, so that it can be used later in a paste operation.
- Rename
- Renames the file associated with this node.
- Definition Type Node
- Represents a definition type of something in the source code. Definition Type node have always a file node as parent. The definition nodes of a file are dynamically updated when a project is opened or when you edit a file. Jabberwocky recognizes the following definition types:
 defclass
- Represents the definition of a class in a source file.
 defconstant
- Represents the declaration of a constant in a sourcefile.
 defgeneric
- Represents the definitions of the generic functions in a source file.
 defmacro
- Represents the definitions of the macros in a source file.
 defmethod
- Represents the definitions of the method functions in a source file.
 defparameter
- Represents the declaration of a parameter in a sourcefile.
 defstruct
- Represents the definitions of the structs in a source file.
 deftype
- Represents the definition of a type in a sourcefile.
 defun
defun- Represents the definitions of the functions in a source file.
 defvar
- Represents the declaration of a variable in a sourcefile.
- Definition Node
- Represents the definition of a function, generic function, method, struct or macro in a source file. A definition node has always a definition type as it parent indicating its type (the icon should also give away its type). A definition node has the following entries in its popup menu:
- Open
- Opens the source file containing this definition (or make the editor buffer containing this file current) and position the cursor at the definition. Double clicking this node has the same effect.
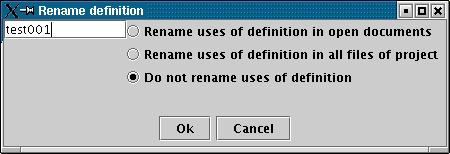
- Rename
- Renames the definition associated with this node. In addition it is possible to rename also every instance of use of this definition in all the project files or of the open files is possible (as indicated by the following dialog box (which is opened if you select this option)).
Typing in lisp code can be done via a editor buffer. Editor buffers are
used in the following cases:
- Editing source code.
- During the creation of a watchpoint for entering the watch
expression.
- When you create a conditional breakpoint, for entering the
condition.
- In a interaction window.
- In a watch buffer.
When you type in text in a editor buffer (or when you move the cursor
around) the editor automatically highlight the opening and closing
parenthesis of the lowest level list containing the cursor. The editor tries
to take in account the existing of comments, character literals and strings
to do a correct highlighting of the parentheses. At the left bottom of the
IDE window (the message area) you will also find a text containing the first
few beginning and the last ending characters of the containing list, this
will help you to ensure parenthesis balancing even when a lisp spans more
then one page.
With each editor buffer is also a syntax analyzer associated, this
analyzer will whenever you modify something analyze the modified piece of
code and provide you with syntax coloring. Keywords, variables,string
literals,vector literals, character literals and the head of a lispform will
all have their own color which can be changed via
<Option><Color>. The syntax coloring will be done
in background, so your typing speed will not be influenced, this means also
that you have to wait a little bit before you see the effect of syntax
coloring. The editor is smart enough to not analyze the whole source whenever
you type something but only the minimum part of the document that is
influenced by your modification. Once the syntax is determined the background
color of the containing list is changed to give you a visible clue that
syntax coloring is done and which list you have modified. During syntax
analyzing a list of lexical variables, function definitions and macro
definitions is also maintained. When in the project explorer you will be able
to see the defined functions (normal,generic and methods) and of the defined
macros. The hint window is also able to show the lexical variables that can
be used or in addition to the predefined functions (macros), the functions
(macros) in all open projects can be shown in the hint window. The syntax
analyzer does more than just recognizing keywords, if you have for example
some syntax errors in the lambda list of a function definition, the color of
the defun keyword is different then when you have no syntax errors,
this should in theory allows you to recognize most syntax errors during
typing. Syntax of the standard ANSI COMMON LISP lispforms is recognized but
you can add your own syntax if needed see Extending the
syntax analyzer for more details.
Code completion, when you type in a ( the editor will automatically
add the closing ) the cursor is then placed in the middle of the empty
list. The same thing happens with ". Code completion can be turned
on/of with <Option><Character Completion. Be aware of
the fact that turning off code completion can slow down syntax coloring,
starting a opening hook or a opening double quote makes the rest of the
document part of a big list (string), which will be changed if you type the
closing hook (double quote). The effect is that a very big part of the
document needs to be reanalyzed. If code completion is on you can insert a single ( or "
by pressing <ctrl><shift><(> or <ctrl><shift><">.
If code completion is off, these keysequences will give you a () or a ""
The editor can help you to indent you code correctly, pressing <tab>
on a line add enough blanks at the beginning of the line so that it is
indentated correctly. If you have enabled
<Options><Indentate on enter> then pressing enter
to create a new line will automatically indentate this new line correctly.
During editing you can also display a hint window that can give you syntax
information and a list of words that can complete the word you are typing in,
see hintwindow for a picture.
Press <alt-space> to toggle the display of the hint window. The
hint window contains two panes. The top one gives you syntax information
about the current lisp form, this information comes from a lisp process, so
its empty if no interaction buffer is running (the CMUCL process gives the
most useful information for the moment). The bottom pane gives you a list of
possible choices to complete the word containing the cursor. If you are in a
empty list or a the begin of a list representing a LispForm the list of known
macros, functions, generic functions and methods is displayed, if you are at
the second position in the definition of a function,macro, generic function
or method a list of the undefined function (macro calls) is displayed (this
allows you to see in a quick glance which functions and macros are used but
not yet defined), finally in the other cases a list of the lexical defined
variables is shown. Jabberwocky waits on the syntax analyzer before
displaying the hint window (this to ensure that he bases himself on the
correct information), so it can take a short time before the hint window is
displayed. You can scroll through the list of choices via
<ctrl-up> and <ctrl-down>. To replace the current
word with the choice selected in the list choose <alt-enter>.
A editor buffer editing a source can be splitted horizontal (or vertical)
in two editor buffers editing the same source (via
<Workarea><Split Vertical(horizontal)>. Both new
editor buffers will refer to the same document, edits done in one buffer will
be visible in the other buffer. The document edited in one editor buffer can
be changed to a document in another buffer via
<Workarea><Replace Document>. These features allows
you viewing different portions of the same document and copy and paste
between different regions of the same document.
The editor buffer has like all modern editors the following editing
commands.
| Delete the previous character |
<backspace> |
| Delete the next character |
<delete> |
| Selecting a piece of text |
Press <shift> and move the cursor around
You can also use the mouse to select a piece of text |
| Copy the selected text to the clipboard |
<ctrl-insert> |
Copy the selected text to the clipboard
and delete the selected text |
<ctrl-delete> |
| Delete the selected text |
<delete> |
| Replace the selected text |
Start typing the new text |
| Send the selected text to the current interaction buffer |
<ctrl-enter> |
| Paste the text in the clipboard |
<shift-insert |
| Undo last edit |
<Edit><Undo Last Edit> |
| Redo last edit |
<Edit><Redo Last Edit> |
| Move to the begin of a line |
<ctrl-a> |
| Move to the end of a line |
<ctrl-e> |
| Move to the begin of a list |
<alt-left> |
| Move to the end of a list |
<alt-right> |
| Move to the begin of the next leaf |
<ctrl-right> |
| Move to the end of the previous leaf |
<ctrl-left> |
There are basically three ways to do a search:
- Incremental search
- Incremental search and replace
- Interactive search
Incremental search
You start a incremental search via <ctrl-n> (forward search)
, <ctrl-p> (backward search) or via the Edit menu. During
a incremental search you can enter your search string in the Input Area.
Jabberwocky will highlight the first occurance of a match found against your
search string. This highlight will automatically be adjusted if you modify
your search string. Once in incremental search mode you can clear the search
string with <ctrl-delete> or change the search direction with
<ctrl-n> (forward search) , <ctrl-p> (backward
search). If you have reached the end (begin) of the buffer a automatic wrap
around takes place. You leave the incremental search mode by clicking in a
editor buffer.
Incremental search and replace
You start a incremental search and replace session via
<ctrl-r>, you get then the same functionality as for a
incremental search to search for a occurance of a search string. Once you
have typed in the correct search string, you can press <enter>
and can then type in a replace string, when you press then
<enter> the found occurance will be replaced by your replace
string and Jabberwocky search for the next occurance of your search string,
pressing <enter> replace again this occurance and so on.
Interactive search
A interactive search allows you to do a multifile search using regular
expression matching or case sensitive(insensitive) simple string matching.
The occurances are shown in a table which display a checkbox, the filename of
the source searched, the line containing the occurance and the begin position
of the occurance. The following picture should clarify this:
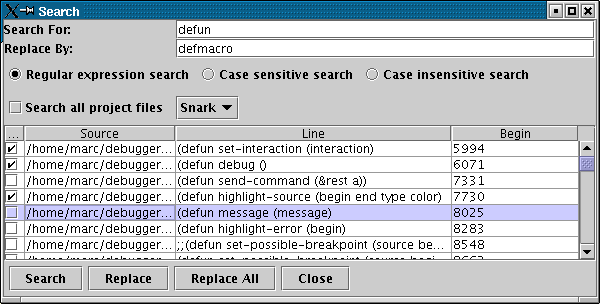
To use interactive search press <ctrl=f> or the
<Edit><Find and replace> menu. Once the dialog box is
opened type in your search expression and choose <Regular expression
search>, <Case Sensitive search> or <Case
Insensitive search>. If you want to search in all the files in a
project, enable <Search all project files> and choose the
project to search in via the combobox. Press now <Search> and
all the occurances will be displayed in the table. If the source containing a
occurances is displayed in the Editor Area you click on the occurance and the
editor buffer containing the occurance will become current, the occurance is
highlighted and shown in the editor buffer. If you double click on a
occurance the file containing the occurance will be loaded in a editor buffer
and the same thing happens. For the replace operation you can type in now the
replace string and use the checkboxes in the first column of the table to
specify which occurances should be replaced by the replace string. Pressing
<Replace> will the replace all the marked occurances by the
replace string. You can also replace all the occurances by the replace string
by pressing <Replace All>. To stop the interactive search press
<Close>.
You can indentate the source code in the following ways:
- Manual indentation
- You type in spaces to correctly indent your source code.
- Auto indentation
- Whenever you type in a <newline> the corrected number
of spaces are added to correctly indent the new line that you are
adding.Auto indentation can be turned on/of via
<Options><Indentate on enter>.
- Indentate Element
- The toplevel element containing the cursor is replace by a
(hopefull) correct indentated version. You indentate a element via
<shift-tab> or <Edit><Indentate
Element>
- Indentate Document
- All the code in the current editor buffer is replaced by a
indentated version. You indentate a document via
<Edit><Indentate Document>
You can always undo the indentation operation via the undo facility of the
editor. The indentation follows the following rules:
Auto indentation
- If the new line is in a list starting with
defun,defgeneric,defmethod or defmacro,
position the cursor in the column which is one character after the begin
parenthese
- If the new line is in a list starting with cond, position the
cursor in the column which is one character after cond
- If the new line is in a list starting with if,do or
do*, position the cursor in the column one character after the
(if,do or do*) for the second or third element and
position the cursor in the column one character after the begin of the
list for the other elements.
- If the new line is in a list starting with
when,unless,let or let*
, position the cursor in the column one character after the
(when,unless,let or let*) for the second
element in the list and position the cursor in the column one character
after the begin of the list for the other elements.
- If the new line is in a list, position the cursor in a column one
character after the begin of the list for the first element, for the
other elements in the list position the cursor in the column containing
the begin of the second element if the previous line contains the first
two elements of the list and position the cursor beneath the begin of
the previous element on the previous line in all other cases.
Indentate element/document
In contrast with auto indentation indentation of a element or document can
add/remove newlines and spaces to get properly indentated code. The
indentation algorithm tries to put as much as is possible on one line without
causing lines longer then a specific max line length and following the
indentation rules for special lisp forms. The maximum line length can be set
via <Options><Max Line length> The rules are as follow
:
- Comments
- Multiline comments (starting with #|) or comments starting
with ;;; will always start on a new line and.
- Comments starting with ;; starts on the same position as the
indentation algorithm dictates for a non comment element.
- Comments starting with ; starts on space after the previous
element (if this element is a non comment) or on a new line beneath
the starting position of the previous element if the previous element
is a comment.
All comments will end with a new line.
- Function,macro,method and class definitions are indentated in the
following way:
- The first line will contain the begin parenthese followed by
defun,defmacro,defmethod,defgeneric or
defgeneric (in lower case),then the name of the object defined
and this is then followed by a argument (class) list which is
indentated as a variable list.
- The remaining lines will contain the lispforms making up the body
of the definition and they will start two columns after the begin
column of the list containing the definition. Each form is indentated
properly and the last form is followed by the closing parenthese
- A if form is indentated as follows:
- First we try to put the opening parenthese,the if string,
the condition, the then,the eventual else part
on one line separated by a space.
- If the previous case would yield a line longer then the maximum
line length or if the condition or the then part spans
more then one line, the opening parenthese and the condition
is placed on one line, the then part starts on a new line 3
columns after the begin column of the list, the eventual else
part starts also on a new line on column after the begin column of
the list
- A cond form
- The first line will contain the opening parenthese, the cond
string in lower cases a space and then the first
cond-expression.
- All the other cond-expressions will start on a new line
beginning in the same column as the first cond-expression
- The last cond-expression will be followed by the closing
parenthese.
The cond-expressions are indentated like a normal list.
- A do or do* form
- The first line will contain the opening parenthese, the do
or do* string in lower cases, then a space and then the
variable declarations indentated as a variable list.
- The ending condition will start on a new line in the same
column as where the variable declaration starts.
- The body forms will start on a new line 2 columns after the
begin column of the list. The last form is followed by the closing
parenthese.
- A let,let*,flet or labels form
- The first line will contain the opening parenthese, the
let,let*,flet or labels string in lower
cases, then a space and then the variable declarations
indentated as a variable list.
- The body forms will start on a new line 2 columns after the
begin column of the list. The last form is followed by the closing
parenthese.
- A when or unless form
- First we try to put the opening parenthese, the when or
unless string, the condition and the body-form
on one line separated by a space.
- If this fails because we exceeded the max line length. we do the
following:
- The first line will contain the opening parenthese, the
when or unless string in lower cases, then a space
and then the condition.
- The body forms will start on a new line 2 columns after
the begin column of the list. The last form is followed by the
closing parenthese.
- If this also fails we do the following:
- The first line will contain the opening parenthese and the
when or unless string in lower cases
- The condition and body forms will start on a new
line 2 columns after the begin column of the list. The last form
is followed by the closing parenthese.
- A case, ccase, ecase, etypecase or
ctypecase form.
- The first line will contain the case, ccase,
ecase, etypecase or ctypecase string followed by
a space and then followed by the key form.
- The clause forms will start on a new line, 2 columns after
the start column of the list.
- A normal list (a list which is not a variable list or any of the above
lists) is indentated as follows:
- First we try to put the opening parenthese, the list elements
separated by spaces and the closing parenthese on on line
- If this fails we try to put the first the opening parenthese and
the first two elements separated by a space on one line, and the
remaining elements each on a new line starting in the same column as
the second element. The las element is followed by the closing
parenthese.
- If this also fails then we put the opening parenthese and the first
element on line, and all the other elements on a new line starting in
the same column as the first element. The last element is followed by
the closing parenthese.
- A variable list (a list used for variable declarations) is indentated
as follows:
- First we try to put the opening parenthese, the list elements
separated by spaces and the closing parenthese on on line
- If this fails then we put the opening parenthese and the first
element on line, and all the other elements on a new line starting in
the same column as the first element. The last element is followed by
the closing parenthese.
The following help facilities are available for Jabberwocky
- A context sensitive hint system, see displaying hints
- The documentation of Jabberwocky, press <F1>
- The Lisp HyperSpec if configured, press <F2>
- Context sensitive Lisp HyperSpec definitions if configured, press <Shift><F1>
The documentation can be shown via the following browsers:
- A native browser, written in Java
- Konqueror
- Netscape
- Mozilla
- Internet Explorer for the Windows platform
To set the Help Browser use <Options/Set the browser for help>.
To configure the HyperSpec support you must first download it. The HyperSpec is maintained at Harlequin and can be downloaded from Common Lisp HyperSpec. Expand then the downloaded file to a directory on you filesystem and use then <Options/Directory of Hyperspec files> to tell Jabberwocky where the HyperSpec files are.
Don't forget to save the configuration settings via <Options/Save Configuration>
It is possible to let Jabberwocky record the activation of the actions, the text typed
in the Input Area and keystrokes send to a editor buffer. Jabberwocky will however not
record mouse events (like drag and click), this due to the fact that in that case replaying
would require user input, which is not a very good idea when replaying takes place.
Once recorded you can do a replay of the macros.
When replaying a macro the new context (current editor buffer and cursor position)
will be used. Jabberwocky saves the named recorded macros during exiting so named
macros can be reused in the next session. To use macro recording use the
following steps. The following figure shows the macro explorer to interact
with a macro.
- Start Recording
- You start recording by either pressing
<cltr-m><ctrl-b>, <Edit><Start
Recording> or by right clicking on "All Macros and Lisp
Objects" in the macro explorer window. From now on every action
that you execute (with the exception of the Start Recording,Stop
Recording and Replay Recording actions), every key stroke send to a input buffer
and whatever you type in the Input Area will be recorded.
- Stop Recording
- You stop recording by either pressing
<cltr-m><ctrl-e>, <Edit><Stop
Recording> or by right clicking on "All Macros and Lisp
Objects" in the macro explorer window. A question appears then in
the Message Area asking you to type in the name of the macro which
will contains the recorded information. If you do not type in the
name of a macro the special name "*" will be used which points to
the current macro. The recorded information will then be associated
with the chosen macro name and the current macro. The new macro is
visible in the macro explorer.
- Replay Recording
- You replay a record macro by either pressing
<cltr-m><ctrl-r>, <Edit><Replay
Recording> or by right clicking on the specific macro in the
macro explorer window. In the first two cases you have to type in
the name of the macro in the Input Area (if no macro is specified
the macro "*" (current macro) will be used).
- Deleting a macro
- To delete a macro, use the macro explorer and right click on the
macro which must be deleted.
Task window
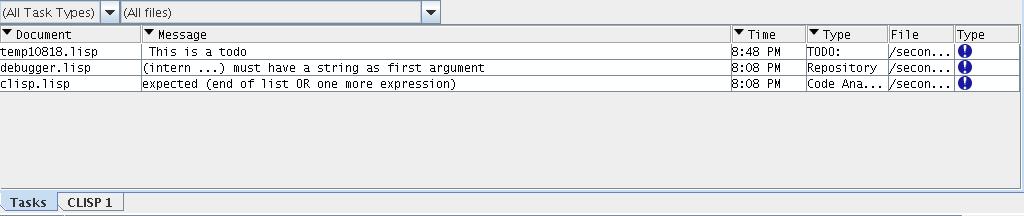
The task window shows you a overview of the tasks, errors and warnings that Jabberwocky finds
in our code. The content can be filtered on the type of the entry and on the file referred to in the entry.
Sorting can be done on Document, Message, Time and Type. When you click on a entry, the editor buffer containing
the document that is the source of the entry is selected (opening the file in a new editor buffer if needed) and the
cursor is posisioned on the lisp form that caused the creation of the entry. This allows you to quickly find a form
that contains a error or that causes a problem in Jabberwocky. The following types of entries are possible:
- Code Analyzer
- When the code analyzer (the component responsible for the syntax coloring), does
find a possible syntax error (because he does not understand a lisp form) a warning is created in the Task window,
this is in general a genuine syntax error, but beacause the code analyzer is not a real compiler, you can get false
alarms.
- Load
- Any errors detected when evaluating the toplevel forms of a editor buffer,
during a 'Load Editor Content With Error Check'.
- Repository
- Any problem that the analyzer responsible for the creation of the project content encounters. This
could be a genuine syntax or semantic error, or it could be just a warning that due to a limitation of Jabberwocky,
a project entry does not contain the correct information.
- TODO:
- If you add a comment containing 'TODO: some text', then this interpreted as a TODO: marker and
the 'some text' is displayed in the the Task window.
Interaction buffers
To start a interaction buffer with a LISP process use
<Interaction><New Interaction with CMUCL(CLISP)>.
This will start a process running the chosen LISP interpreter and opens also
a editor buffer to interact with this process. When you type
<enter> Jabberwocky tries to find the last lisp expression in
the editor buffer and sends it to the LISP process via stdin, the output from
stdout(stderr) is then displayed in the editor buffer. Communicating with the
LISP process happens in background, so a problems in the LISP process should
not cause a hang of Jabberwocky (hopefully). A interaction buffer is needed
if you want to debug some source code or if you want some syntax information
in the hint window. If you close the interaction buffer, all sources debugged
by this interaction buffer will be put back in editor mode and all watches
using this buffer will be deleted.
Once a interaction buffer is established you can work with it in the
following ways:
- Set the current directory
- You can set the current directory for the lisp process by using either
<File><Set the current directroy> or by clicking
on the project node if the option <Options><Automatic setting of current directory to project directory> is enabled.
- Execute
- Select a editor buffer and either select a piece of code or click
on a LISP form to highlight it (it could be that you have to wait
on the background parsing for the highlighting). By either pressing
<ctrl-enter> or choosing
<Interaction><Execute> the selected or
highlighted code will be send to the current interaction buffer,
which will send it to LISP process to be executed. The result is
displayed in the interaction buffer. Be aware that if the selected
text contains unbalanced parentheses, that you have to interrupt
the lisp process with <ctrl-c> otherwise it will wait
for ever on the closing parentheses.
- New Watch Window
- Select a interaction buffer and choose then <Interaction><New Watch Window>.
A new watch window on the the lisp process in the interaction buffer is then started. This allows you to
evaluate expressions, without causing a break in the lisp process if they contain a error.
- Load Editor Content
- Select a editor buffer and press <ctrl=l> or choose
<Interaction><Load Editor Content>. The content of
the editor buffer will then be send to the current interaction
buffer to be loaded by the LISP process.
- Load Editor Content with Check
- Select a editor buffer and choose <Interaction>Load Editor Content With Error Check>.
All the toplevel forms of the editor buffer are send after each other to the Lisp process, any error in
executing a toplevel form is reported in the Task window. If there are any errors, the Task window is selected
showing the errors for the file loaded. This gives you a quick way of locating and correcting all the errors
in a editor buffer.
- Compile Editor Content
- Select a editor buffer and choose
<Interaction><Compile Editor Content>. The content
of the editor buffer will then be send to the current interaction
buffer to be compiled by the LISP process.
- Interrupt
- Press <ctrl-c> or choose
<Interaction><Interrupt> to execute the (break)
from in the LISP process associated with the current interaction
buffer.
- Command History
- By pressing <ctrl-h> or choosing
<Interaction><Command History> a dialog box
containing a list of the last commands entered is shown. You can
scroll through this list via the up/down key, pressing enter will
send the selected command to the current interaction buffer,
pressing esc will close this window.
Watch Windows
A watch window is a editor buffer that allows you to send a form to the lisp subsystem
for evaluation. The difference with a editor buffer is that the stdin, stdout is not used and that
a error in the evaluation does not cause a break in the lisp process. This allows you te evaluate forms when
debugging code or when running code is waiting on input from the console.
Before you can debug a document, make sure that you started a LISP
interaction window and that you have made it current, select then the editor
buffer containing the source that you want to debug and press on to put the editor buffer
in debug mode. When a editor buffer is place in debug mode, its content will
be saved to a temporary file. Instrumentation code is then added to this file
and the file is loaded by the LISP process of the current interaction buffer.
A association between the instrumented code and the editor buffer is then
made, thanks to this the debugger can bring the editor buffer to the
foreground when a breakpoint is encountered. Once a editor buffer is in debug
mode no editing of the document inside in it is possible. When you put back
the buffer in edit mode the readonly flag is removed from the document and
the original source code is loaded in the LISP process removing the
instrumentation code. Everytime you select a editor buffer in debug mode a
debug menu is added to the menubar and the following buttons are added to the
button bar. If a editor buffer contains not just definitions but also some forms
to execute (like testcode) it is better to use the following method (instead of
debugging the whole source) (the editor goes in debugmode only when all the
instrumented code is loaded and this can take some time for large source). It is also
possible to control the generation of the instrumented code. Two options exist for
this :
- Instrument the debug after code
<Options><Interaction><Instrument the debug after code>
- When this option is disabled and the Instrument the check after code is also disabled then
node code will be generated to allow you to use the step after functionality.
- Instrument the debug after code <Options><Interaction><Instrument the check after code>
- Enabling this option, enables the generation of code which causes the entering of the debugger in case of a error and the extra code for step after debugging.
These options are considered advanced options, you should use them for example to make the instrumented code
smaller, to improve load times (or compile times if you want to compile intstrumented code (be warned
that the CMUCL compiler has some problems with dense code)).
It is also possible to debug selected code or the current form in a editor
buffer without putting the editor buffer itself in debug mode. To do this
select a piece of code or position the cursor in a form and press
<ctrl-d> or choose <Interaction><Debug
Selection/Form>. The selected code or the current toplevel form will
then be copied in a new buffer which is placed in debug mode so that you
debug only the selected code (current toplevel form). Disabling debugging of
this extra buffer will automatically close it.
 |
Return editor buffer to edit mode |
 |
Toggle a breakpoint |
 |
Toggle a conditional breakpoint |
 |
Step Into |
 |
Step Over |
 |
Stop At |
 |
Continue |
 |
Stop After |
 |
Add Watchpoint |
 |
Change Return Value |
 |
Step Backward In Time |
 |
Step Forward In Time |
 |
Start (reset) Profiling |
 |
Stop Profiling |
Once a buffer is in debug mode, you can set a (conditional) breakpoint by
placing the cursor on a lisp form and pressing () . The
background color of the LISP form containing the cursor is then changed to
indicate that a breakpoint is set on this LISP form. If you have set a
conditional breakpoint, a popup editor buffer appears to specify the
condition of the conditional breakpoint. The (conditional) breakpoint is
entered whenever the LISP form is executed (for a conditional breakpoint, the
condition has to evaluate to something else then NIL). When debugging code
the following states exist :
- Running code is in control
- The LISP process is executing the different LISP forms.
- Entering a form
- The LISP process is halted before executing the LISP form and
this LISP form is highlighted in the editor buffer. Control is then
given to the debugger.
- Leaving a form
- The LISP process executes the LISP form of 2 and halts, the
executed LISP form is highlighted and control is given to the
debugger.
Controlling the execution of code
Once control is given to the debugger the following is possible:
- Step Into
- Control is given to the running program to execute the current
form and then the next form is entered.
- Step Over
- Control is given to the running program to execute the current
form and the next forms, until a form in the same list (or a form
with a debugpoint on it) is encountered which is then entered.
- Stop At
- Before using Stop At, a form should be selected, control is then
given to the running program to execute the current form and the
next forms, until the selected form (or a form with a debugpoint)
is encountered, which is then entered.
- Continue
- Control is given to the running program to execute the current
form and the next forms, until a form with a debug point is
encountered which is then entered.
- Stop After
- If a form is entered, control is given to the running program to
leaf the current form. When the form was left, Stop After has the
same effect as Step Into.
- Change Return Value
- Works only when a form was left, will change the returned value
of the form. Step Into,Step Over,Stop At, Continue or Stop After
must then be used to give control back to the running program.
Time Traveling
The debugger has also a feature called time traveling, when a form is
executed a history of the call to the form is maintained (currently the
history depth is 100, but this can be changed with (DEBUGGER::prepare-time
depth)). Each entry in the history contains a reference to the lisp form
executed and a save of the lexical environment at the moment of the call).
With time traveling you can step back or forward in time, highlighting the
lisp forms which where executed at the chosen time and restoring the lexical
environment so that you can watch the variables at that time. The following
controls are possible for traveling:
- Step Forward In Time
- Highlight the lisp form executed after the current form (do a
wrap around if the current form was the last form executed) and
restore the lexical environment of the new form.
- Step Backward In Time
- Highlight the lisp form executed before the current form (do a
wrap around if the current form was the first form in history) and
restore the lexical environment of the new form.
Error handling
When during the run of debugged code a error occurs in the running code,
the debugger is entered and the form which caused the error is highlighted.
You can then use Change Return Value to set the return value of this form and
continues execution.
Watching
When a editor buffer is in debug mode the state of a running program can
be consulted on the following ways:
- By setting a watchpoint
- A popup editor buffer appears to allow you to enter a LISP form,
a watchpoint is then entered to the watch explorer, each time the
debugstate changes, the form associated with the watch point is
evaluated and the result is visible in the watch explorer.
- Result of evaluating a form
- When Step After is used you can control the value of the executed
LISP form, via the result watch point in the watch explorer.
- Using the cursor
- When you place the cursor over a variable and hold it there for
some time, the value of the variable is displayed in the editor
buffer. If the word beneath the cursor is not a variable, a error
is given in the message area.
- <Interaction><New Watch Window>
- When you select this menu point, a buffer is started which is
associated with the interaction buffer. Whenever a program is
running in the interaction buffer and the debugger is in control
you can use the watch buffer to type in LISP forms which will then
be executed in the context of the running program. The result is
displayed in the watch buffer.
Profiling
Profiling allows you to do coverage analysis, when profiling is enabled
the system will maintain for each lisp form executed a count of how many
times this form is called. A slider is provided to allow you to highlight
these forms executed at least as many times as the slider indicates. The
following controls are possible:
- Start (reset) Profiling
- Enables profiling (or reset the form counters), shows also a
slider to control the highlighting
- Stop Profiling
- Disable profiling and removes the slider
ASDF support
It is possible to install asdf packages using Jabberwocky. Be aware of the following
limitations:
- There is currently no support for managing and/or creating packages, only for installing existing packages.
- The asdf-install support is only tested for clisp,cmucl and sbcl.
- The list of available packages is hardcoded in Jabberwocky, there is currently no
way to extract this from cliki, any suggestions on
how to do this are welcome.
- Jabberwocky uses asdf-install
to do the installation, errors could be caused by Jabberwocky, asdf-install or the
package itself.
For more information on asdf see asdf
and asdf-install.
Adding asdf support.
Asdf support is not automatically enable, to enable it choose
<Options><General><Configure ASDF for Jabberwocky>
the following window appears then:
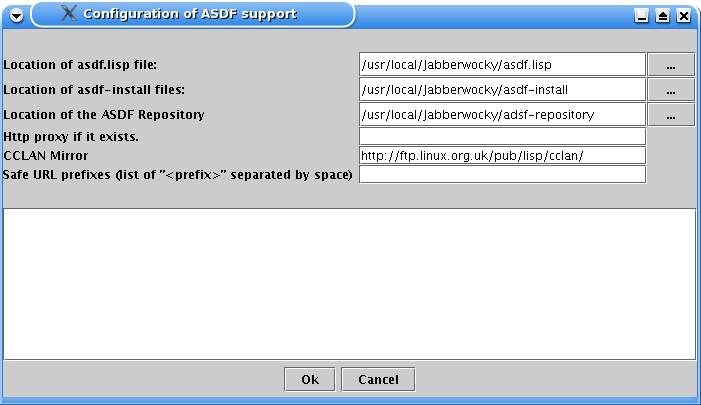
The input fields have the following meaning:
- Location asdf.lisp file.
The pathname of the asdf.lisp file
that contains the code for asdf. - The current distribution does not contain
asdf itself, you can download the latest version from
asdf download.
This ensures that you have the latest version of asdf.
- Source directory of the asdf-install files.
- Jabberwocky does not come with asdf-install, you can download the source
files from asdf-install download>
and expand this *.tgz file in a directory of your choice.
- Loaction of the ASDF repository.
- ASDF maintains a list of places where it will look for system definitions when it is asked to
load or compile a system. When Jabberwocky compiles asdf-install, it will place
the system definitions of asdf-install in this directory.
- HTTP Proxy
- The http proxy server to use, if needed.
- CCLAN Mirror
- URL of the mirror of CCLAN, default is
http://ftp.linux.org.uk/pub/lisp/cclan.
- Safe URL prefixes
- List of URL's enclosed by double quotes and
separated by spaces. When a package URL starts with one of these URL prefixes, the PGP
signature check is not performed when this package is installed.
When the Ok button is pressed, Jabberwocky will compile the asdf.lisp file
for the different available lisp interaction buffers, and if succeeded will compile and
install asdf-install. Don't forget to do a save of the options to ensure that
Jabberwocky remembers that asdf support is added. The bottom text box contains a output
of the compilation and installation process, you should include the contents of
this window when you send a bugreport.
Installing asdf packages
To install a asdf-package select <Interaction;><Use asdf-intall
to install a lisp package>, the following window will then appear:
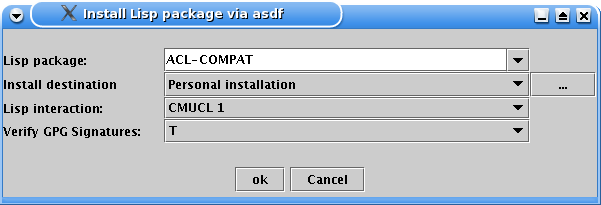
- Lisp package
- The lisp package to install, the dropdown list
is hard coded in Jabberwocky, if your package is not listed, just type it in
the combo box.
- Install destination
- The destination of the compiled lisp
libraries and the destination of the asdf definitions. You can initially between
a personal installation (in your home directory) or a system destination
(administrative rights needed). If you want to see the destination locations or
add your own destinations, press the ... button, the following window will the open
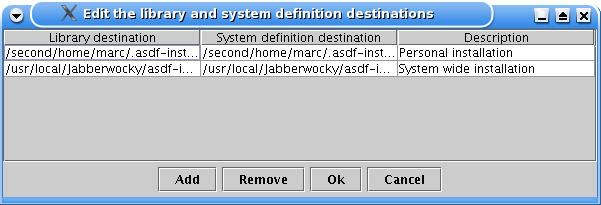 , here we have:
- Library destination
- The location of the compiled lisp library.
- System destination
- The location of the asdf definition file.
- Description of the destionation
- A description of the destination.
- Lisp interaction
- The lisp interaction that you will use
to do the installation, the package is only installed for the lisp system that is
used by this lisp interaction.
- Verify GPG
- Skip/No Skip of the signature check of the downloaded
package.